| Actin speckle dynamics |
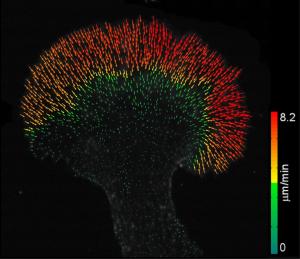
Actin flow vector field |
 |
 |
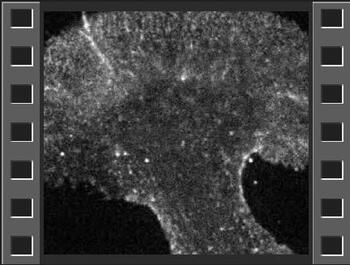
Time lapse movie of a neuronal growth cone that has been
injected with a trace amount of fluorescent actin subunits
which appear as “speckles”. Note the constant flow of actin
speckles from the leading edge of the growth cone inward.
This flow represents the movement of treadmilling actin
filament arrays which drive neuronal growth. |
Thirty second sample of the speckle movie at left were
sampled to generat the flow field above. Flow velocities
coded in color.
|
|
Actin vs microtubule dynamics
|
Microtubule dynamics |
|
|
|
|
Left panel: Microtubule vs neuronal growth cone structure
Right panel: actin filament (red) vs microtubule (green) dynamics
|
Microtubule speckle microscopy. Microtubule plus end and internal reference shown by white and blue markers, respectively. |
|
Turning on and off actin filament assembly
|
Jasplakinolide slows the rate of actin filament turnover |
|
|
|
|
Time lapse movie of the effects of suddenly turning off
actin filament assembly in a neuronal growth cone by
addition of a compound (cytochalasin B) that inhibits
actin monomer addition to the fast growing end of the
polymer. Recovery during cytochalasin washout also shown.
|
The ROI tracks an area of actin speckles over time and its
rate of intensity decay can be used to assess actin turnover.
Note that the both ROI moves shrinks in area more slowly
over time in jasplakinolide an agent that stabilizes actin
filaments and makes them resistant to cofilin mediated
severing.
|
|
|
|
|
|
|
Actin filament network treadmilling is maintained by a
polymerization and depolymerization processes that
exist in a kinetic steady state. Red and green actin
speckles appear and disappear, respectively, when
actin subunits enter and leave the actin polymer network.
The first part of the move shows instantaneous behavior;
the second part is an integration over time. Note the high
probability of actin subunit incorporation at the leading
edge of the growth cone where the density of actin
nucleation sites is high.
|
Total actin (green) and photo-converted td-eos-actin (magenta)
expressed in CAD cells. Movement of the td-eos-actin ROI reveals
retrograde actin flow and decay of this signal is a measure of the
rate of actin filament turnover when compensated for photo-bleaching.
Localised td-eos-actin photo-conversion by exposure to 405 nm laser
illumination projected via a digital micro-mirror array.
|
| |
|